Written by: Chloe Rowan
Birchbox is the UK’s number 1 beauty box. Subscribers receive a monthly box containing five samples of beauty products to test without having to buy the full-sized product. The boxes are tailored to suit the subscriber’s needs, for instance, a subscriber with straight hair would not receive a product for curly hair, but subscribers can also choose one of the five products they receive or select their preferred box design, adding a further element of personalisation.
The Campaign
Birchbox decided to launch a Whichit campaign. They identified their target audience as females aged 18-35, living in the UK and Ireland. They wanted a fun and innovative way to engage this audience, with the aim to increase brand awareness and drive sales.
The strategy was to create a 6-question Whichit quiz to collect actionable insights about their consumers’ makeup preferences and beauty routines. The quiz was to appear as a native ad, on a branded landing page, on the Birchbox website. The user would be presented with a different outcome based on their preferences, and each Engage Card offered a discount code and a clear Call-to-Action button.
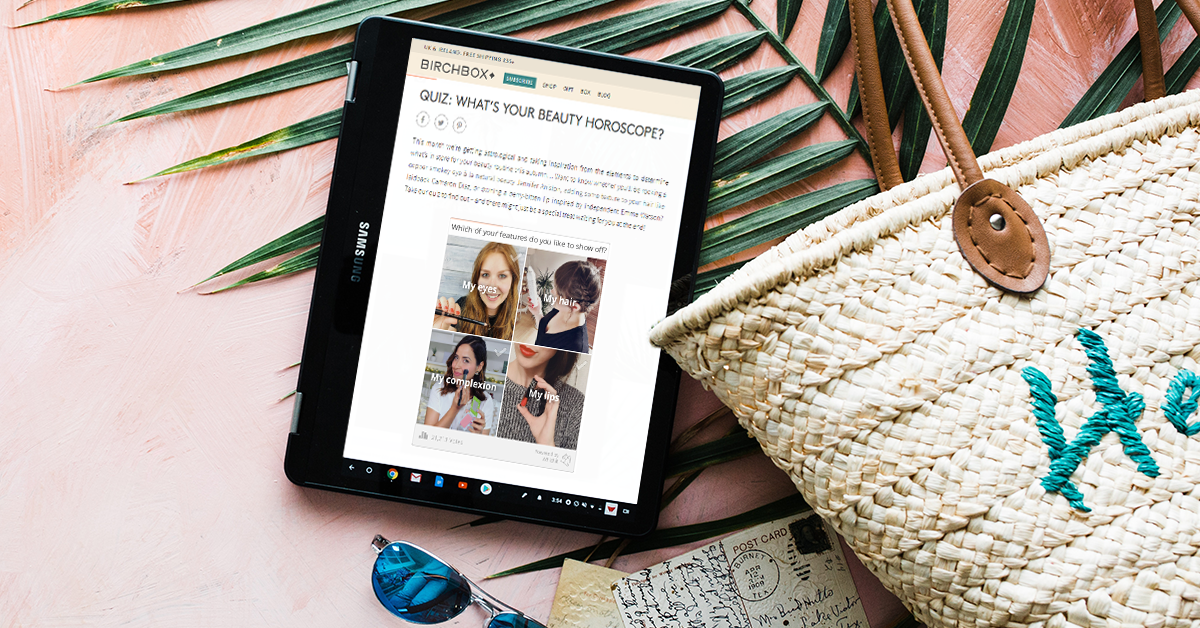
Click on the image to discover your beauty horoscope.
The quiz featured attractive images and a series of fun questions about beauty routines, astrology, and the season’s favourites, allowing Birchbox to grab the audience’s attention and raise brand awareness from the start. The answers also provided Birchbox with valuable information regarding their target audience’s preferences including their influencers, favourite body feature, and preferred colour palettes.
The final question was “Are you a Birchbox Subscriber?”, which enabled the quiz to determine which personalised offer and Call-to-Action it should display on the Engage Card once the quiz was complete.
Success
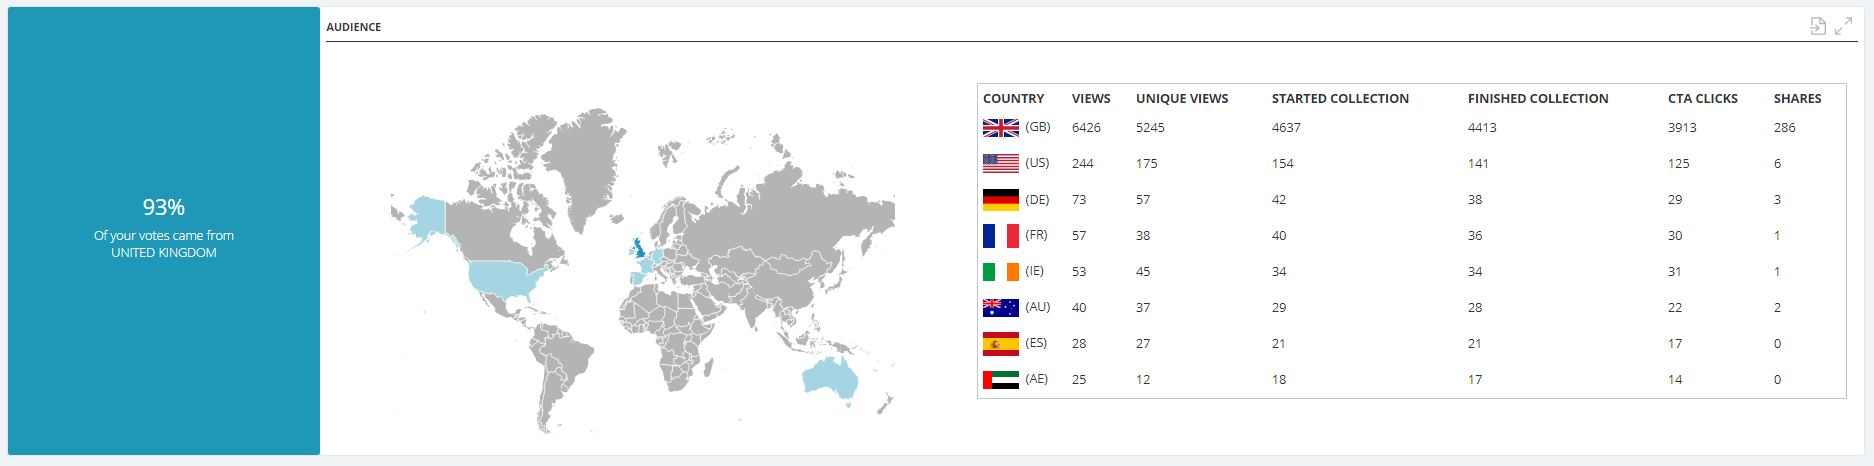
The campaign ran on a Birchbox branded landing page within their website for 10 days and generated over 24,000 unique views. The campaign was a huge success, achieving an 89% engagement rate, made up of 60% potential new subscribers, and 40% existing clients.

Birchbox achieved 97% Completion rate and 89% Engagement rate in just 10 days thanks to Whichit. Click to read full case study.
Of the 89% who engaged with the ad, a huge 97% completed it, and 31% carried out the Call-to-Action. The ad was also shared on social media 113 times, amplifying the brand awareness.
Everyone who completed the quiz was taken to an Engage Card with a brief description of their beauty horoscope, the latest beauty trends for them to look out for, and influencers they should watch. Existing clients were then offered a free blending sponge with any purchase from the Birchbox online shop, while non-subscribers were given a voucher code to receive a 50% discount off an October box.
The answers collected throughout the campaign gave Birchbox vital product and rutine information. This data can be used to help personalise subscriptions and improve customer satisfaction during and after the campaign.
The audience enjoyed the interactive quiz, and it was such a success that Birchbox have continued to create Whichit campaigns as part of their marketing strategy!